|
|
Research Article
Online laboratory evaluation of seeding-machine application by an acoustic technique
Hadi Karimi
University of Tabriz, Faculty of Agriculture, Department of Agricultural Machinery. Tabriz, Iran
Hossein Navid
University of Tabriz, Faculty of Agriculture, Department of Agricultural Machinery. Tabriz, Iran
Asghar Mahmoudi
University of Tabriz, Faculty of Agriculture, Department of Agricultural Machinery. Tabriz, Iran
| |
Abstract
Researchers and planter manufacturers have been working closely to develop an automated system for evaluating performance
of seeding. In the present study, an innovative use of acoustic signal for laboratory evaluation of seeding-machine application
is described. Seed detection technique of the proposed system was based on a rising voltage value that a microphone sensed
in each impaction of seeds to a steel plate. Online determining of seed spacing was done with a script which was written in
MATLAB software. To evaluate the acoustic system with desired seed spacing, a testing rig was designed. Seeds of wheat, corn
and pelleted tomato were used as experimental material. Typical seed patterns were positioned manually on a belt stand with
different spacing patterns. When the belt was running, the falling seeds from the end point of the belt impacted to the steel
plate, and their acoustic signal was sensed by the microphone. In each impact, data was processed and spacing between the
seeds was automatically obtained. Coefficient of determination of gathered data from the belt system and the corresponding
seeds spacing measured with the acoustic system in all runs was about 0.98. This strong correlation indicates that the acoustic
system worked well in determining the seeds spacing.
Additional key words:
seeds spacing; seed detection technique; acoustic system; acoustic signal; impact plate.
Abbreviations used:
MAPE (mean absolute percentage error); TSW (thousand seed weight).
Citation: Karimi, H.; Navid, H.; Mahmoudi, A. (2015). Online laboratory evaluation of seeding-machine application by an acoustic technique.
Spanish Journal of Agricultural Research, Volume 13, Issue 1, e02-002, 8 pages. http://dx.doi.org/10.5424/sjar/2015131-6050.
Received: 10 Apr 2014. Accepted: 21 Jan 2015.
http://dx.doi.org/10.5424/sjar/2015131-6050
Copyright © 2015 INIA. This is an open access article distributed under the Creative Commons Attribution License (CC by 3.0), which permits unrestricted
use, distribution, and reproduction in any medium, provided the original work is properly cited.
Funding: This research was supported by the Department of Agricultural Machinery, Faculty of Agriculture, University of Tabriz, Iran.
Competing interests: The authors have declared that no competing interests exist.
Correspondence should be addressed to Hadi Karimi: hadi.karimi@tabrizu.ac.ir; hadiekarimi@gmail.com
|
IntroductionTop
Precision spacing of seeds can provide maximum space for each plant, reducing intra-specific competition and increasing yields
(Yasir et al., 2012). Precision spacing also decreases seed scattering and disproportionate use of seeds due to uniform distribution (Anantachar et al., 2010). Identical germination and growth of plants make the subsequent operations, such as weeding and harvesting, easy with lower
costs (Li et al., 2012; Taghinezhad et al., 2013). Approaching to precise seed spacing requires accurate field and laboratory test techniques for evaluating seeding performance.
In laboratory tests, sticky belt stand is one of the most frequently used methods (Önal & Önal, 2009). Although it is accurate it has some limitations such as: i) limited number of data that can be obtained by the length of
the belt, ii) manually determining the seeds spacing is time-consuming and iii) there is high risk of sliding or bouncing
seeds on the sticky belt, especially at high belt speed (Kocher et al., 1998). However, it is convenient and has been tried by some researchers for evaluating a single row seed metering mechanism (Panning, 1997; Molin et al., 1998; Singh et al., 2005; Anantachar et al., 2010; Zhan et al., 2010; Li et al., 2012; Önal et al., 2012; Yasir et al., 2012).
Among other alternative techniques, an opto-electronic seed spacing determination system has been developed (Kocher et al., 1998; Lan et al., 1999) which determines time intervals between seeds by detecting seed drop events relative to the planter. Panning et al. (2000) found that the spacing measured from the opto-electronic system was 15 mm greater than the theoretical one and the inaccuracy
of the opto-electronic sensor was related to seeds with diameter <3 mm.
With current advances in digital video technology, machine vision has shown potential as a sensing technology for seeding
performance evaluation. In this case, spatial distribution of seeds is measured with a digital camera for recording of passing
seeds and a computer for data processing and monitoring. Results from this machine vision technique have shown a good accuracy
(Alchanatis et al., 2002; Karayel et al., 2006; Navid et al., 2011), but machine vision systems require defined and consistent lighting and advanced calibration (Brosnan & Sun, 2004). In addition, results of computer vision are influenced by the quality of the captured images and artificial lighting might
be required for the proper imaging (Singh et al., 2013).
Lately, non-destructive acoustical experiments have been progressively executed in agricultural engineering and its accuracy
is proven in detection and classification of agricultural products (Pearson, 2001; Cetin et al., 2004; Pearson et al., 2005; Karimi et al., 2012; Khalesi et al., 2012). To the best of authors’ knowledge, there are no papers in the scientific literature exploring the use of acoustic in evaluating
planter’s performance. In this study, an online acoustical technique is developed for laboratory evaluation of seeding-machine
application.
Material and methodsTop
Seed
Acoustic signals characteristic of an impacted seed is in relation with the seed physical and mechanical properties. In order
to evaluate the devised system performance with different seed shapes, seeds of wheat (Triticum aestivum L) cv. ‘Alvand’, corn (Zea mays) cv. ‘Sc 704’ grains and pelleted tomato (Solanum lycopersicum) cv. ‘sun F1’ were used as experimental materials (Fig. 1).
|
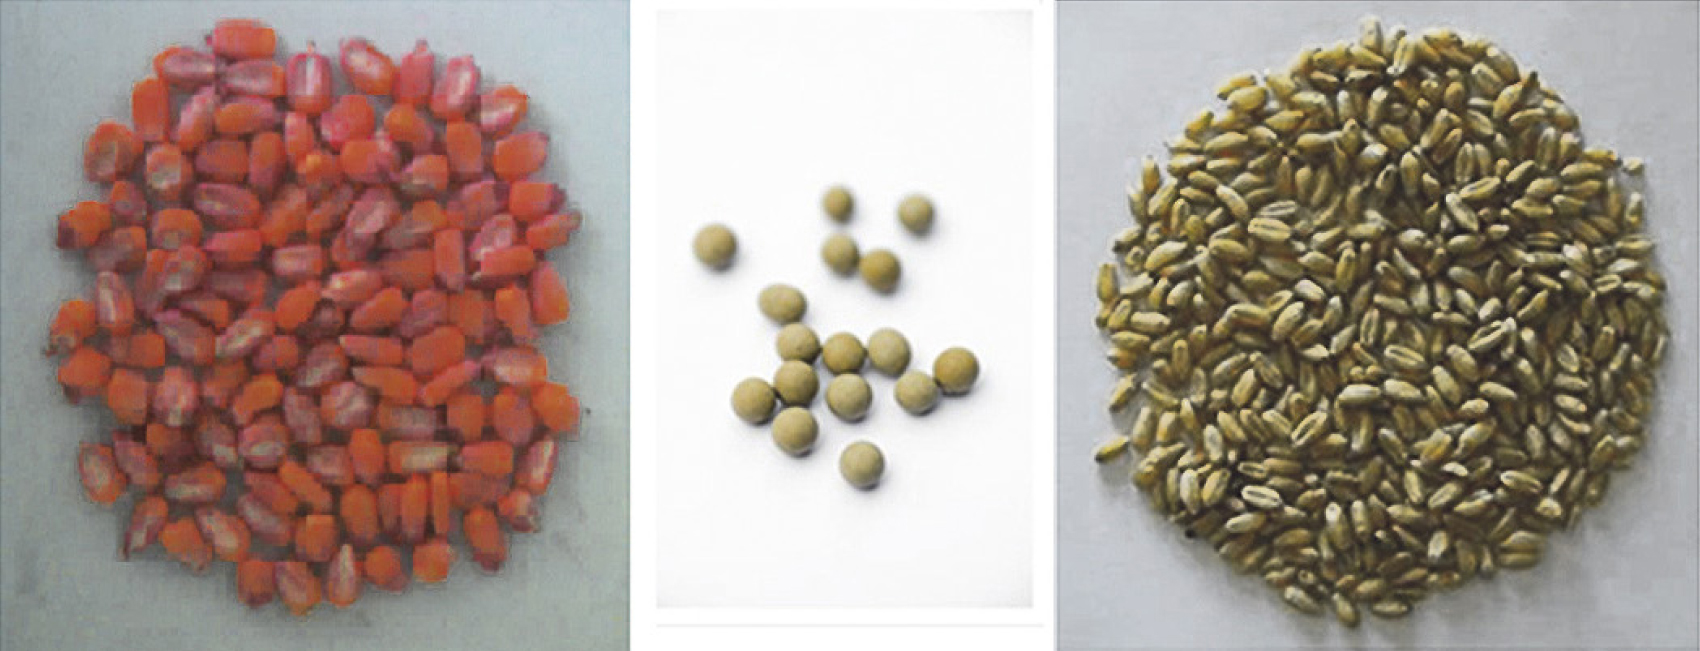 Figure 1. Corn ‘Sc 704’ grains, pelleted tomato ‘sun F1’ and wheat ‘Alvand’ seeds.
|
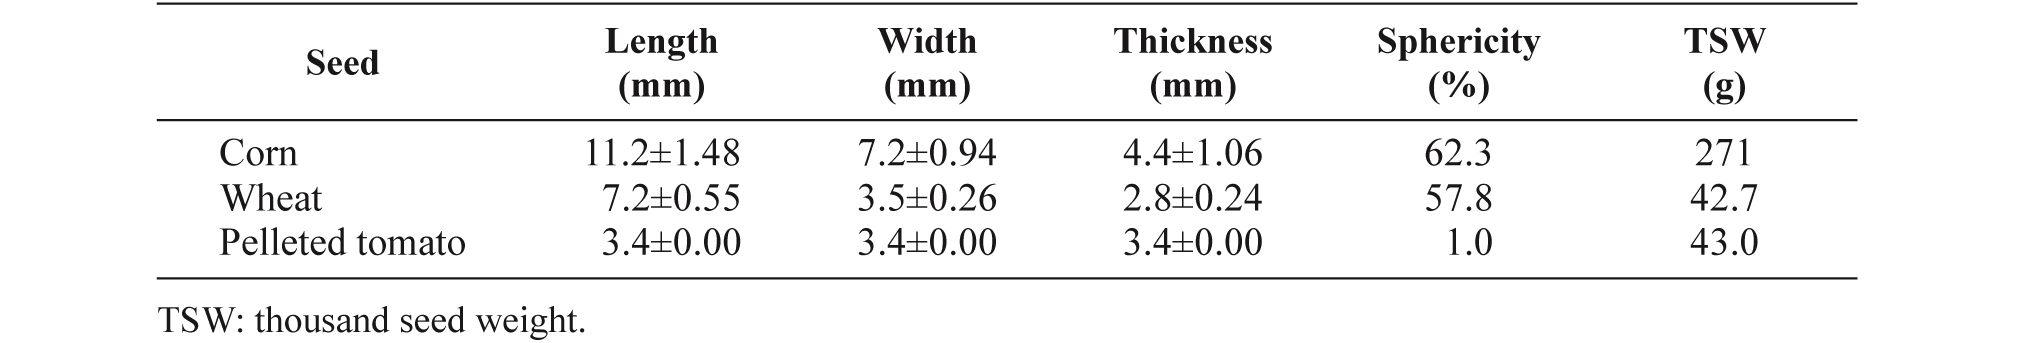
A vernier caliper was used to determine length (L), width (W), and thickness (T) of about 50 randomly selected seeds of each
sample. Axial dimensions were used to determine sphericity (Sp) using the Mohsenin (1986) formula:
Thousand seed weight (TSW) was measured by sampling 50 seeds and weighing them in an electronic balance (accuracy 0.001).
This weight was then multiplied by 20 to give the mass of 1000 seeds. The mean values and standard errors of acquired properties
of the seeds in ten repetitions are presented in Table 1.
Table 1. Some physical properties of selected seeds used as experiment materials. Mean values and standard errors in ten repetitions
Testing rig
To evaluate the acoustic system with desired seed spacing, a testing rig was designed. The testing rig was composed of a belt
and an acoustical system (Fig. 2). The belt was 11 m long and 40 cm wide. A 2-cm narrow trajectory was settled on the belt to prevent seeds from moving laterally.
The acoustical system consisted of an impact plate, an acoustic unit and a PC-based data-acquisition. The impact plate was
fixed at the 30° angle right under the end point of belt so that each falling seed from the belt would impact one time to
the plate. This angle was determined by an adjustment using several trails. Falling distance from the end point of the belt
to the impact plate was fixed to 20 cm. Initial experimental results showed that for sensing seeds steel plates provided better
performance than glass or wooden ones. The impact plate was made of a polished block of stainless steel about 10×10×0.6 mm.
A microphone (Panasonic, VM-034CY model) was used with frequency sensitivity up to 100 kHz, for capturing impact sound signals.
To reduce the environmental noise effects, the microphone was installed inside an isolated chamber filled with glass wool
to prevent acoustical reflections. Microphone output was sent to a PC based data-acquisition where it was digitized using
a sound card (Intel® 82801 BA/BAM AC’97 Audio controller) at a sampling frequency of 44.1 kHz, with 16 bit resolution. The
PC was used for acquiring, saving and processing the data.
Measurement procedure
Seeds spacing was determined based on a rising voltage value that the microphone sensed in each seed’s impact to the plate.
For this purpose, MATLAB software was used. This software in data-acquisition toolbox allows to acquire data from sensors
and to send out electrical signals that can be used to control or drive external devices (Toolbox, 2010). This toolbox was
employed by utilizing sound card hardware and the microphone as the data-acquisition device. An analog input trigger was defined
as an event that initiated data logging (Fig. 3). The trigger occurred when a proper signal was detected with the specified conditions on the hardware channel.
The device was put into a continuous acquisition mode, and acquisition began when start commend was set. The collected data
were analyzed in order to detect the specified trigger condition. If the data did not contain the trigger condition, they
were discarded. When the trigger condition was met, the engine begins storing data. These data were retrieved subsequently.
By an adjustment using several trails, it was found that the most appropriate threshold point that could sense the three kinds
of seeds at one time is 0.4 volts. Primary experiments also showed that putting 0.4 volts for triggering sound card caused
environmental sounds not being able to start data acquisition except impaction of seeds. Moreover, for all three kinds of
seeds, when the logging data for each seed’s impact sound continued for 0.015 sec after passing this point, no rising in the
voltage value equal or greater than 0.4 volts would happen. Therefore, setting data acquisition on logging data with 700 samples
for each impact sound (when the sound card frequency is set to 44.1 kHz) provided system to sense each seed one time. Data
acquisition was configured with a sound card based on voice activation. The sample rate was set to 44.1 kHz, and data was
logged when an acquired sample had a value equal to or greater than 0.4 volts and a rising slope. After triggering, upon getting
a trigger signal the computer acquired 700 data points from every sample in the time-domain. Typical data acquired from pelleted
tomato seed with desired condition is shown in Fig. 4.
|
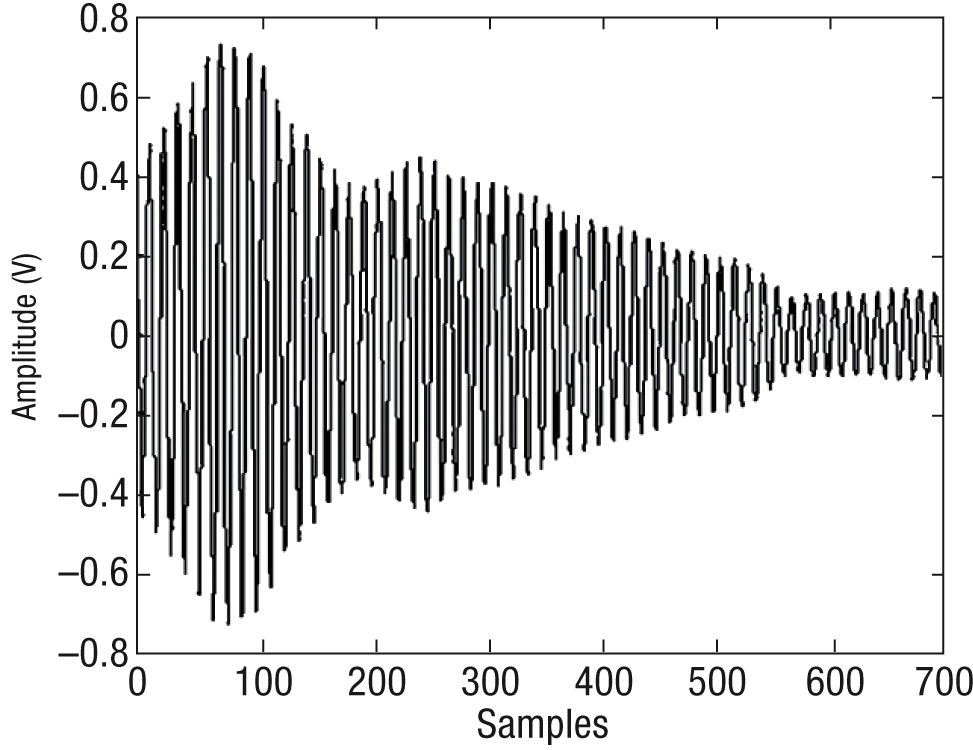 Figure 4. Typical data acquired from pelleted tomato seeds.
|
According to the described principles, a script was written in MATLAB software, in each loop, trigger time and data for each
trigger was obtained. Flowchart for written script is demonstrated in Fig. 5. According to Eq. [2], after applying the illustrated procedure, seed spaces (dx) were calculated by the time difference (dt) and simulated speed of a planter (V).
Evaluation method
For evaluation of the acoustical technique, seeds were positioned manually in the trajectory line on the belt with distinctive
spaces (10 to 40 cm intervals). For each space range, the experiment was replicated 5 times. The seeds were positioned just
in the first 3.5 m of the belt so that the running belt had time to reach to a steady state operating condition. When the
belt was running, the positioned seeds on the trajectory line were falling from the end point of belt, so seeds were impacting
to the plate one by one and related seed spacing data were acquired by the acoustical system. In each stage of the experiment,
the belt simulated travel speed was set up to 0.5 m/s.
The mean absolute percentage error (MAPE), also known as mean absolute percentage deviation (MAPD), is a quantity used to
measure how close forecasts or predictions are to the eventual outcomes (Makridakis et al., 2008). It usually expresses accuracy as a percentage, and is defined by the formula:
where fi is the prediction and yi is the actual value. As the name suggests, the MAPE is calculated by dividing the absolute errors ei = | fi – yi| by the actual value. The absolute value in this calculation is summed for every predicted point and divided again by the
number of fitted points n; multiplying by 100 makes it a percentage error. MAPE have the advantage of being scale independent, so they are frequently
used to compare forecast performance between different data series (Hyndman, 2006). In this research MAPE criterion was used to evaluate the acoustic system performance in determining value of seed spacing
in different spacing ranges for corn, pelleted tomato and wheat seeds. Hence, the acoustical data defined as prediction outcome
(fi), belt system data defined as actual value (yi) and number of spacing data defined as n in MAPE formula.
MAPE results obtained for corn, pelleted tomato and wheat seeds in different spacing ranges are shown in Fig. 7. The results show that by increasing the simulated spacing pattern in the belt system, the MAPE got closer to zero and then
more accurate spacing measurement by the proposed system is available. On the other hand, the acoustic system had better results
with larger spacing between the seeds. In addition to have better comparison between corn, pelleted tomato and wheat seeds,
MAPE of acoustic system in determining seeds spacing in the total of all spacing ranges was calculated. As shown in Fig. 8, MAPE results for corn, pelleted tomato and wheat seeds was respectively 3.89%, 4.13% and 5.3%.
DiscussionTop
Sticky belt stand is the method commonly used by researchers as a reference technique to test the seed spacing of each planter
configuration (Panning, 1997; Molin et al., 1998; Singh et al., 2005; Anantachar et al., 2010; Zhan et al., 2010; Li et al., 2012; Önal et al., 2012; Yasir et al., 2012). In sticky belt stand test setup, the planter is placed above a moving belt covered with adhesive material so that the seeds
that impacted to the belt remain at the point where they hit the belt. Then, the belt is stopped, and the location of each
seed on the belt is recorded manually (Alchanatis et al., 2002). A common point between the proposed acoustic system and the sticky belt stand method is using impaction factor as an event
for determining the seeds. However, the opto-electronic and machine vision system used another technique for seed spacing
determination. They use the common technique of measuring time interval between seed drops and location where each seed drops
from the seeding unit. Nevertheless, the performance of these systems was evaluated with the same seed spacing measurements
obtained using the sticky belt test stand as a reference method (Kocher et al., 1998; Lan et al., 1999; Panning et al., 2000; Karayel et al., 2006; Navid et al., 2011). Considering the fact that the proposed acoustic system uses the same technique, which is used by sticky belt stand as a
reference method, in comparison with above mentioned systems, better performance of the acoustic system is expected.
Furthermore, the benefits of the proposed acoustic system in comparison with the sticky belt method are: (1) unlimited number
of data can be obtained by acoustic system; acoustic system seed spacing determination is not restricted due to infinite data
acquisition possibility provided with PC and MATLAB software; whereas, in the sticky belt method, the length of the belt limits
number of data that can be obtained (Navid et al., 2011); (2) automatic seeds spacing estimation is time and job saving in acoustic system in comparison with manually determination
in sticky belt stand; assessment of seed spacing in sticky belt method requires time for measuring the spacing and entering
the data into a computer (Lan et al., 1999); instead, in the proposed system, the data of seed spacing is automatically saved and prepared for subsequent analyses;
(3) risk of sliding or bouncing seeds is eliminated; in the sticky belt method, for subsequent visual assessment, seeds should
remain at the point where they hit the belt, a concern is that, even with adhesive material usage on the belt (usually grease),
impacted seeds may still slide or bounce on the belt, particularly at high belt speeds (Kocher et al., 1998); instead, the acoustic system senses the seed immediately after the seeds impacting to the plate, in this case no sliding
or bouncing would affect spacing determination; (4) real time monitoring of seeding performance is available with online determination
of seeds spacing in acoustic system; in the sticky belt method, unlike online monitoring of seed spacing in the proposed system,
spacing is determined manually when seeding operation has been stopped; whereas, online monitoring of seed spacing makes online
evaluation of seeding-machine application possible in acoustic system during the operation; (5) one of the main advantages
is its low cost versus sticky belt method; while the main hardware of the proposed system is a cheap microphone, the sticky
belt stand is composed of several costly parts, such as long belt, AC motor, speeds changer and a support stand.
Moreover, significant simplicity and low cost of proposed acoustic system is also expected in comparison with opto-electronic
and machine vision systems; such that opto-electronic seeds spacing determination systems are costly and include complex hardware
and software (Önal & Önal, 2009). Also, the machine vision systems require package of software and hardware to capture the images of seeds, to segment the
seeds from the background of the image, and to calculate the spacing between two seeds (Alchanatis et al., 2002; Karayel et al., 2006; Navid et al., 2011).
Another advantage of the acoustic system is easy calibration process. By determining proper threshold point adjusted with
several trails, no irrelevant sound except seed’s impact sound can run the system. instead, the machine vision system requires
defined and consistent lighting (Brosnan & Sun, 2004).
As Fig. 7 shows, by increasing theoretical seed spacing the MAPE decreased for corn, pelleted tomato and wheat in determining seed
spacing. It means that the acoustic spacing prediction is closer to the actual value in minor seed distances provided by the
belt system. Therefore, it is clear that by increasing theoretical seed spacing for planting, accuracy of the system would
be increased. Moreover, Fig. 8 shows that the MAPE was calculated in determining corn seeds spacing in the total of all spacing ranges with better results
in comparing with pelleted tomato and wheat seeds spacing measurement. Substantially better results for corn seeds can be
related to TSW of corn. Table 1 shows that the TSW of corn is heavier than the pelleted tomato and the pelleted tomato is heavier than the wheat seeds. Considering
the TSW from Table 1 and the MAPE results from Fig. 8, an obvious relation between seeds weight and accuracy of seed spacing measurement is easily detected. It is concluded that
the proposed acoustic system is expected to have better results with heavier seeds. This result might be due to more intensive
impact sound signal carried out by heavier seeds.
In this study, primary tests were done through trial and error method to investigate appropriate data acquisition setting
to sense all utilized seeds at once. In other words, same data acquisition setting (including threshold point) was successfully
found for all utilized seeds. Our results have shown that with advanced setting in data acquisition of impact sound signal
for different kinds of seeds with various shapes used in this study, good accuracy of seed spacing can be determined by the
designed acoustic seed spacing evaluation system. Nevertheless, seeds with different physical properties may need special
setting for impact sound data acquisition.
According to the mentioned results, it is clearly argued that good performance for the acoustic system is expected for seeds
which are greater than the small sized seeds of this study. Extension of this method for smaller sizes and weights of seeds
could be continued up to a point where ability of smaller seeds to make impact sound signals is higher than entering ambient
noises into the isolated chamber. In this case, determining proper threshold point to start data acquisition of seed impaction
would not be possible.
However, improving the accuracy of the acoustical system seems to be possible if the following suggestions would be followed:
utilizing a sound card with more sampling frequency (> 44.1 kHz), increasing the attenuation of the impact sound signal by
using thicker stainless steel blocks as impact plates and reinforcing the chamber’s isolation ability to reduce the environmental
noise.
In addition, the main efforts in this study were made to develop a system as simple and cheap as possible. Some investigations
are recommended in future works about acoustic seeds spacing determination system, as developing an adaptive detection algorithm
and using a data conditioning method to eliminate the ambient noise.
Furthermore, to the best of our knowledge, no successful automatic system for determination of damaged seeds caused by malfunction
of seeding mechanism except the acoustic technique has been reported in the scientific literature. Seed breakage can be a
problem in planters with mechanical metering devices and it is an important parameter in the evaluation of seeding machine
application performance. In a previous research (Karimi et al., 2012), feasibility of detecting damaged seeds was investigated in evaluation of seed metering mechanism with this acoustic technique
and neural network. Results showed high capability of the acoustic system for identifying damaged seeds.
Advantages of the proposed system, besides its good accuracy, are automatism and online seed spacing determination, low cost,
simplicity and easy calibration in laboratory conditions. Considering these benefits, the extensive use of the acoustical
system in laboratory evaluation of planter would be conceivable in future.